
Nikada
Market Review
The market trend of picking favorites continued in the second quarter, with the tech-heavy Nasdaq 100 (NDX) printing its best ever first half of the year with a 39.4% gain. This compares to 16.9% for the S&P 500 (SP500, SPX) and 4.9% for the more mundane Dow Jones Industrial Average (DJI). These gains materialized despite large US bank failures, a vigilant and hawkish Fed, the threat of a debt ceiling breach and ongoing recession fears. As you have likely heard, the breadth in equity markets has been relatively narrow, with only seven stocks, dubbed “The Magnificent Seven” by Jim Cramer, driving the lion’s share of index returns. In fact, to start the year, these seven stocks produced an average return of ~90%, compared to ~6% for the other 493 stocks in the S&P 500.
The reason for the strong returns among these mega-cap stocks is twofold: First, they faced significant selling pressure in 2022, positioning them for a rebound. (Note: the average decline for The Magnificent Seven composed of Apple, Microsoft, Amazon, Tesla, Meta, Alphabet, and NVIDIA was ~48% last year, with Tesla losing ~70% of its value); Second, the more investors climbed aboard the current generative AI hype cycle, the more they realized the resources required to run and scale this technology are enormous, suggesting that most of the value will likely accrue to the platform providers and the hardware manufactures. Almost every large tech company is vying to own a piece of what will likely prove to be a gigantic, oligopolistic pie. The importance of the major players being major players in this burgeoning technology cannot be overstated given the relative share of total market cap these companies currently command (see chart below).
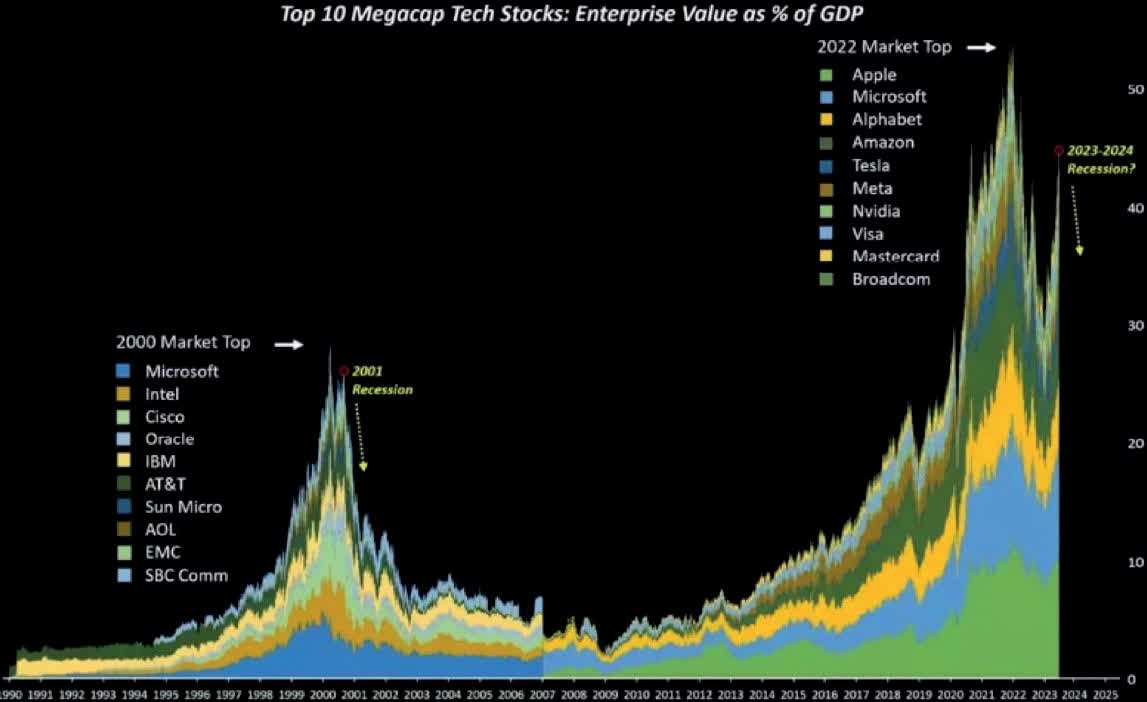
Source: Bloomberg, Kevin Smith
On the monetary policy front, the Fed decided to forego raising rates during its June FOMC meeting, with Chairman Jay Powell remarking they wanted “to gain more information to make decisions” and “allow the economy a little more time to adapt as we make our decisions going forward.” The Fed continues to be laser-focused on bringing down inflation, which has resulted in headline CPI declining from 9.1% at its peak to 3.0% in the latest report. Core CPI, which removes food and energy, has remained more sticky, declining by only 110bps to 4.8% over the last 12 months. It’s plausible that in order for the Fed to seriously consider cutting rates, core CPI needs to make its way back towards its pre-covid level of slightly above 2%. As has been the case for this entire tumultuous period, the market’s expectation for rate hikes (or cuts) remains fluid, and one can’t help but think most assets will continue to experience heightened volatility as investors digest, in real time, the future path of rates. Other fears include the potential for further bank stress that might result in stricter regulations and additional bank capital requirements, which might lead to reduced lending and a higher likelihood of a recession. Fortunately, of late, the markets appear to be discounting a soft landing thanks to the rate of inflation coming down, albeit slowly, and employment remaining surprisingly resilient.
2Q23 Performance
|
PERFORMANCE (%) |
2Q23 |
1 YR |
3 YR |
5 YR |
ITD1 |
|
|
Ithaka US Growth Strategy (Gross) |
16.1 |
39.1 |
7.7 |
14.3 |
17.1 |
|
|
Ithaka US Growth Strategy (NET) |
15.9 |
38.4 |
7.1 |
13.7 |
16.5 |
|
|
Russell 1000 Growth (“R1000G”) |
12.8 |
27.1 |
13.7 |
15.1 |
16.5 |
|
| 1 ITD = inception-to-date, annualized. Inception date is 1/1/2009. |
During the second quarter Ithaka’s portfolio outperformed in a strong market, rising 16.1%. For comparison purposes, the Dow rose 3.4%, the S&P 500 rose 8.3%, the NASDAQ rose 12.8%, and our benchmark, the Russell 1000 Growth Index, also rose 12.8%. Ithaka’s 330 basis points (bps) of outperformance was due almost entirely to stock selection, with a slight benefit from sector allocation. Our portfolio demonstrated modest breadth and depth, with 13 of 28 stocks held for the entire quarter, representing 46% of the names and 54% of the total portfolio weighting, outperforming our benchmark.
At the portfolio sector level Ithaka realized positive relative returns in two of the four sectors in which we hold active bets. Within Technology, our relative overweight to semiconductor companies more than compensated for weakness seen across our Software-as-a-Service and megacap tech holdings. Stock selection in the Health Care sector was strong across the board, with four of our six holdings positively contributing to returns, which was enough to offset a 40bp headwind from our overweight to the sector. Ithaka’s slight underperformance in the Consumer Discretionary sector was concentrated in our brick-and-mortar retailers and our Latin American e-commerce company. Our largest pool of underperformance was in the Financial Services sector, where our two fintech companies and our relative overweight to the sector (~6.5ppts) combined to account for the entirety of the underperformance.
|
Contributors and Detractors |
||
|
2Q23 TOP 5 CONTRIBUTORS (%) |
RETURN |
IMPACT |
|
NVIDIA (NVDA) |
58.8 |
4.0 |
|
Amazon.com (AMZN) |
26.2 |
1.5 |
|
Microsoft (MSFT) |
18.4 |
1.4 |
|
ServiceNow (now( |
20.9 |
1.3 |
|
Intuitive Surgical (INTU) |
33.9 |
1.1 |
|
2Q23 TOP 5 DETRACTORS (%) |
RETURN |
IMPACT |
|
Insulet (PODD) |
(9.6) |
(0.3) |
|
MercadoLibre (MELI) |
(10.2) |
(0.3) |
|
PayPal (PYPL) |
(19.4) |
(0.2) |
|
Tractor Supply (TSCO) |
(5.5) |
(0.2) |
|
Block (SQ) |
(3.0) |
(0.0) |
Top Contributors
NVIDIA Corp. (NVDA)
NVIDIA is the market leader in visual computing through the production of high-performance graphics processing units (GPUs). The company targets four large and growing markets: Gaming, Professional Visualization, Data Center, and Automotive. NVIDIA’s products have the potential to lead and disrupt some of the most exciting areas of computing, including: data center acceleration, artificial intelligence (AI), machine learning, and autonomous driving. The reason for the stock’s appreciation in the quarter was twofold: First, the stock benefited from tremendous excitement surrounding the further development of generative AI and the likelihood this would necessitate the purchase of a large number of Nvidia’s products far into the future; Second, Nvidia posted a beat- and-raise quarter for the history books, where the company upped its F2Q24 revenue guidance above Street estimates by an astounding 50%, causing the stock to gap up ~25% on the announcement.
Amazon.com, Inc. (AMZN)
Founded in 1994, Amazon has evolved from its early roots as an online bookstore to become one of the world’s largest eCommerce retailers. At the end of 2022 Amazon stood poised to capture ~40% of all US e-commerce sales, representing five times more share than the next closest competitor. In addition to eCommerce, Amazon Web Services (“AWS”) has become the market leader in outsourced cloud infrastructure. Further, Amazon Advertising is garnering significant share in digital advertising, particularly product placement ads, thanks to consumers beginning their product searches on Amazon’s site. Despite providing tepid forward guidance on its 1Q23 earnings call, Amazon’s stock appreciated on the back of increased confidence the company would be able to contain expenses and push operating margins above prior peaks in the near-to- medium term.
Microsoft Corporation (MSFT)
Microsoft builds best-in-class platforms and provides services that help drive small business productivity, large business competitiveness, and public-sector efficiency. Microsoft’s products include operating systems, cross-device productivity applications, server applications, software development tools, video games, and business-solution applications. The company also designs, manufactures, and sells devices, including PCs, tablets, and gaming/entertainment consoles that all integrate with Azure, its cloud computing service. In the quarter Microsoft’s stock appreciated on the back of excitement surrounding the company’s positioning in the generative AI market and its ability to monetize the coming wave of corporate investment in supercomputing and AI.
Top Detractors
Insulet Corp. (PODD)
Insulet is a medical device company focused on the design, development and commercialization of insulin pump systems for people with type 1 diabetes. Diabetes is a chronic, life- threatening disease for which there is no known cure. Insulet’s insulin pump system is superior to traditional multiple daily injections because it provides its users with a more accurate and pain free way to administer insulin when compared to injecting it via syringe multiple times per day. Insulet’s stock was under pressure following news that Medtronic purchased EOFlow, the manufacturer of the EOPatch, a tubeless, wearable and fully disposable insulin delivery device. While the EOPatch is not yet launched in the US, it is widely believed it will be available by the end of 2024, increasing competitive pressure on Insulet.
MercadoLibre, Inc. (MELI)
MercadoLibre is the leading e-commerce network/platform in Latin America, connecting merchants and consumers through its industry-leading brands and technology. In addition to its e-commerce prowess, MercadoLibre also owns the dominant regional digital payments platform, MercadoPago. MercadoPago has recently made huge strides in processing payments for off- platform transactions in addition to its longstanding stronghold processing payments for marketplace transactions. MercadoLibre continues to benefit from a flywheel effect, as each business under the company’s umbrella helps bring more users into its ecosystem, leading to more merchants offering more products, which in turn attracts more users. In the quarter MercadoLibre’s underperformance was likely due to overall weakness in the Financial Services sector, and more specifically weakness in the fintech subsector.
PayPal Holdings (PYPL)
PayPal is a leading payment technology platform that enables consumers and businesses to securely send and receive online and mobile payments without disclosing payment card data. As of year-end 2022, the two-sided network had 435mm active customer accounts, 30mm PayPal-accepting merchants, and was active in over 190 markets around the world. In the second quarter all of PayPal’s underperformance followed its 1Q23 earnings announcement when the company announced a beat on the top and bottom line, but issued weak forward margin guidance, which provoked investors to hit the sell button, sending shares down ~20%. Given it’s unknown how long it will take management to implement its revised growth playbook, the investment team decided to exit the position and deploy the capital elsewhere.
Transactions
During the quarter we initiated two new positions, The Trade Desk (TTD) and Cadence Design Systems (CDNS), and eliminated one position, PayPal Holdings (PYPL). We also trimmed our NVDA position twice during the quarter as it crested our self-imposed cap of 8% in any one holding. Our trailing 12-month turnover increased to 12.2% while our trailing 3-year average annual turnover increased to 15.2%.1
Market Outlook
Ithaka claims no expertise in economic or market predictions, and top-down analysis plays a minor role in our approach to investing. We typically take our cues on the markets and the economy from our companies’ management teams as they discuss their business prospects, and industry outlooks, during quarterly calls. Much like during the first quarter, company earnings/press releases during the second quarter appeared to have a larger effect on stock movements than macro data releases and Fed policy decisions. At the individual holdings level, 87% and 93% of our holdings beat top- and bottom-line expectations, respectively, which sent the average stock up ~2%, six stocks up >10%, and two stocks down >10%. The skew in the quarter was decidedly up. When looking past the numbers, there was one theme that dominated almost every earnings call we digested: Generative Artificial Intelligence.
Generative AI refers to a group of models that have been trained on massive amounts of data in order to learn the patterns and structure of their input training data. The models then use their algorithms to generate new data, which could be in the form of text, images, or other media, when prompted or queried. The hope of this technology is it will bring about unprecedented speed and creativity to a large portion of knowledge workers and creators. The number of S&P companies mentioning AI on quarterly conference calls hit a 10-year high of 110 mentions in 1Q and likely printed another record in Q2. Within our own portfolio, 70% of our companies mentioned AI in some form or fashion in the second quarter. Given we are at the beginning of this technology evolution, two camps have emerged to debate the potential impact of AI on our world. The dreamers “preach hope,” believing AI is going to fundamentally change almost every facet of life and render the future exponentially better than the present. This future will consist of AI assistants/ co-pilots who will more efficiently run our lives, make better medical diagnoses, deliver productivity enhancements through the automation of routine tasks, and incrementally improve customer experience for end users in virtually every industry.
Unlike the dreamers, the naysayers believe the AI hype cycle is reaching its fevered pitch and will soon go the way of all the other hyped transformational technologies that came before it (think 3D printing, blockchain, Web3, the Metaverse, etc.), or at least take much longer to pan out than what is currently being proselytized. As is the case with most transformational technologies, we think this one is likely to end somewhere in the middle of these two camps. While we fully acknowledge calling “generational shifts” in technology in real time is nearly impossible, the amount of investment currently being gobbled up by the AI ecosystem significantly increases its probability of adoption into our everyday lives.
Our market outlook section wouldn’t be complete without our obligatory musings on the Fed’s future policy decisions. As it stands today, the Fed has hiked rates 500bps over the past 16 months with one more 25bp hike anticipated in late July, ending at a policy range of 5.25% to 5.50%. The market then assumes a pause at that range through May of 2024 as inflation (hopefully) continues to fall (with core CPI sitting at 4.8% for a real Fed funds rate of 45-70bps). This continues to be a fluid situation as the market is constantly receiving mixed signals from economic data, employment data, and Fed governors. Fortunately, of late, investors at-large appear to have increased the probability of the Fed orchestrating a soft landing while fully appreciating we are not out of the woods just yet.
As always, we end this letter acknowledging that one’s ability to digest, forecast, and accurately discount the above macro factors is pretty much an exercise in futility, and we therefore choose to stay fully invested and focused on our mission of creating wealth for our clients by owning, in size, the great growth stories of our day.
|
1 Turnover Rate indicates the frequency of changes to the portfolio, and is calculated as the greater of the buys or the sells during the period as a percentage of the assets under management at the time of each transaction. The calculation eliminates the effect of client-directed cash flows. Average Annual Turnover is calculated based on a trailing three year period. Risk DisclosurePast performance is not indicative of future results. The performance shown is for the Ithaka US Growth Strategy Composite. All fully discretionary taxable and non-taxable accounts are added to the composite following the first quarter in which their ending market values equal or exceed $0.5 million. Results of individual accounts may vary from the composite depending on account size, timing of transactions and market conditions prevailing at the time of the transaction. The gross-of-fee performance does not reflect the payment of management fees and other expenses that are incurred in the management of an account. The net-of-fee performance includes the payment of such fees and expenses. Gross-of-fee performance and net-of-fee performance both include the reinvestment of all distributions, dividends and other income. The performance shown is compared to the Russell 1000 Growth Index and the S&P 500 TR Index. The Russell 1000 Growth Index measures the performance of the broad growth segment of the U.S. equity universe. It includes those companies from the Russell 1000 Index with high price-to-book ratios and high forecasted growth as compared to other companies listed in the Russell 1000 Index. The S&P 500 TR Index is a market-capitalization- weighted index that measures the performance of 500 leading publicly traded companies in the U.S. The index tracks both the capital gains as well as any cash distributions, such as dividends or interest, attributed to the components of the index. These broad-based securities indexes are unmanaged and are not subject to fees and expenses typically associated with managed accounts. Individuals cannot invest directly in an index. The information provided in this report should not be considered a recommendation to purchase or sell any particular security. There is no assurance that any securities discussed herein will remain in an account’s portfolio at the time you receive this report or that securities sold have not been repurchased. The securities discussed do not represent an account’s entire portfolio and in the aggregate may represent only a small percentage of an account’s portfolio holdings. It should not be assumed that any of the securities transactions or holdings discussed were or will prove to be profitable, or that the investment recommendations or decisions Ithaka makes in the future will be profitable or will equal the investment performance of the securities discussed herein. Investing in securities entails risk and may result in loss of principal. The Ithaka Group, LLC (Ithaka) has entered into a written agreement with Cedar Partners, ltd. (Cedar), which requires Cedar to provide client relationship and marketing services to Ithaka, including the introduction of prospective advisory clients to Ithaka. Cedar is not affiliated with and has no relationship with Ithaka other than a contractual relationship governed by the agreement between Cedar and Ithaka. Ithaka compensates Cedar by the payment of an Annual Retainer plus an Account Fee equal to 20% of the investment management fees paid to Ithaka by clients introduced by Cedar. The retainer is paid during the term of the Agreement between Cedar and Ithaka. The Account Fee is paid for as long as the client’s account is managed by Ithaka. Ithaka has a standard fee schedule and does not charge any additional amounts to clients who were marketed by Cedar to cover the amounts Ithaka pays to Cedar. |
Editor's Note: The summary bullets for this article were chosen by Seeking Alpha editors.
"strategy" - Google News
July 30, 2023 at 02:30PM
https://ift.tt/HpWbyLq
Ithaka US Growth Strategy Q2 2023 Commentary - Seeking Alpha
"strategy" - Google News
https://ift.tt/juGbCpc
https://ift.tt/87uUgij
Bagikan Berita Ini


0 Response to "Ithaka US Growth Strategy Q2 2023 Commentary - Seeking Alpha"
Post a Comment